About the project
Currently BrightEdge wants to improve the rate of new user activation and retain new users using the platform. One approach BrightEdge wants to use is to send users emails with a snipped of a use case. If the user are interested in the use case they will select the call to action. Should the user want further details they can sign up for recurring reports and weekly emails. The purpose of the challenge to design a landing page and a detailed report for the use-case.My Role
For this challenge I created a flow chart to map out the current process, researched landing pages and reports, mockups, and created a wireframe / prototype.Process
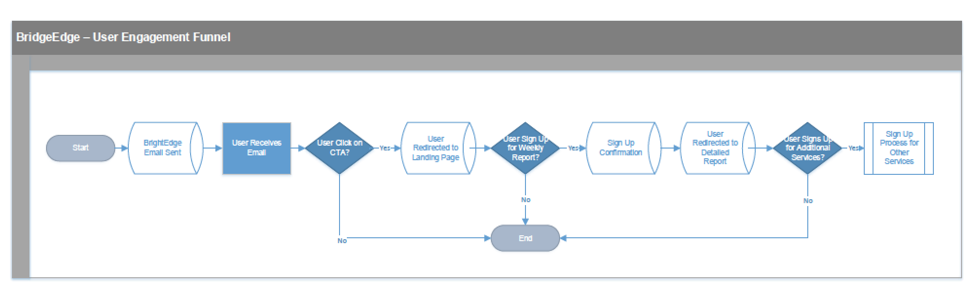
Prcoess Flow
In order to better understand the process a flow chart was created. The flow chart shows the start to finish for the user.
Research
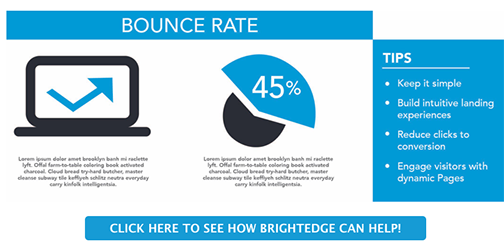
Research was done on the details and elements of a landing page in order to better understand how to engage and target the user. Research was also done on providing a detailed report. Based on the design specifications along with the process flow the landing page would display the areas where the competitors were beating the user. The detailed report displayed information related to the users website and how to improve those areas.
Landing Page
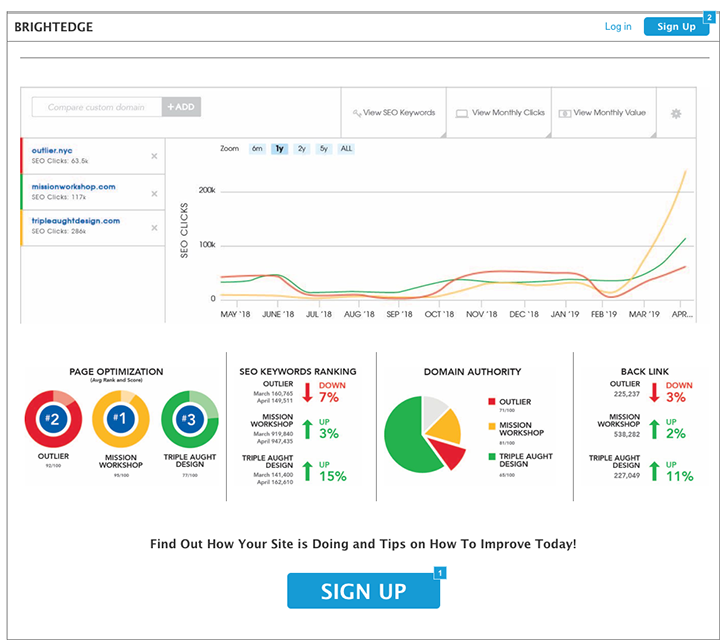
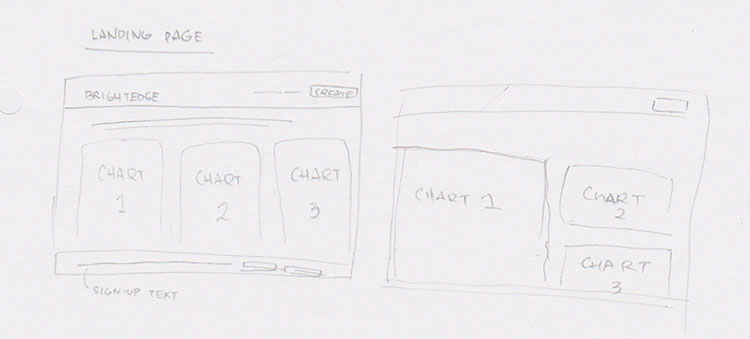
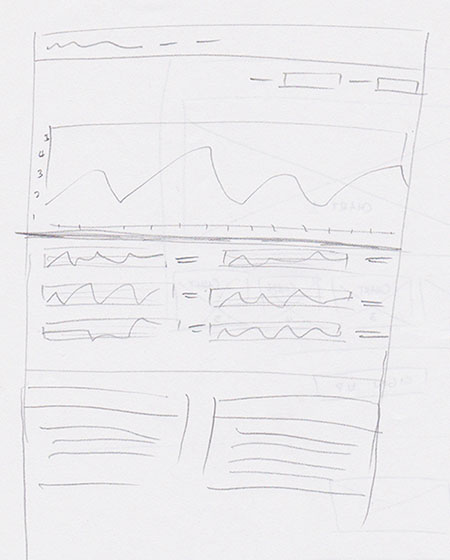
Initial ideas of the landing page were sketched (Sketch 1) out in order to get a better idea of what the user see visually of the landing page. The sketches also provided an idea of how much content should be displayed in order to provide value as well as where the call to action should be displayed. The initial landing page displayed three charts where the competitors are beating the user. The rationale behind this was that the information provided would be just enough to give the user an idea of how they are doing against its competitors but not enough to get a full picture thus encouraging the user to sign up for the detailed report.
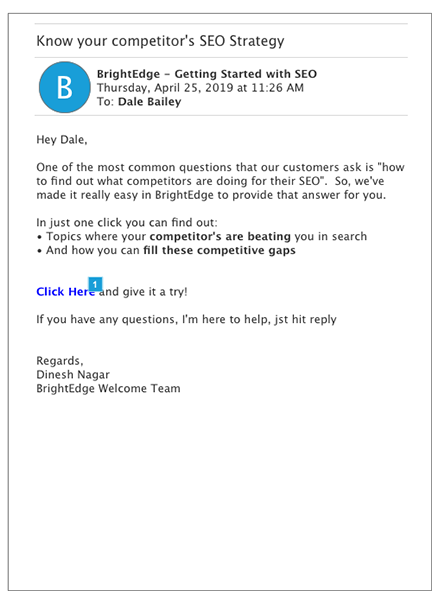
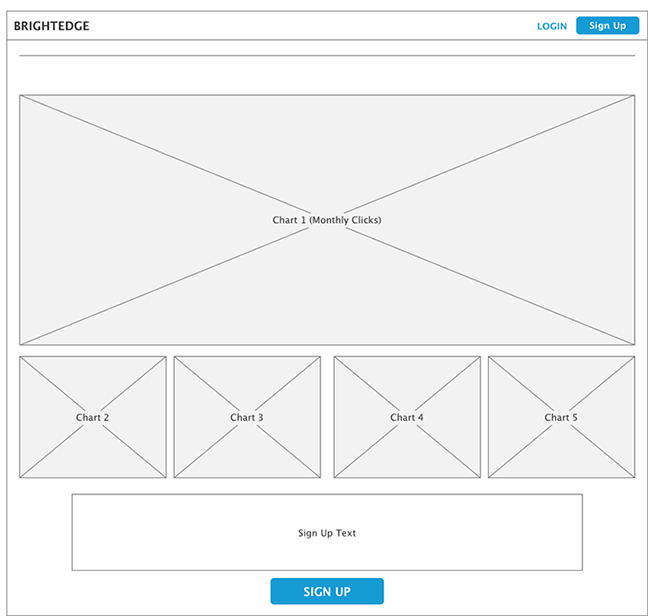
However after some thought it was decided that presenting the user with five charts with information would be more beneficial (Sketch 2 and Wireframe 1). Providing three key pieces of information did not seem to be enough so providing five key pieces of information painted a better overall picture. The idea here is that by painting a more detailed picture it would entice the user to sign up for a detailed report that would provide a better overall picture of their site. The landing page wireframe consist of three main parts. The first being the header with just a simple company logo, login link and a signup button. The second are the charts. The charts are intended to provide key pieces of information of where the competitors are currently doing better. Lastly the third being the call to action. After seeing the key pieces of information the idea here is that the user would want to see how there site is doing. The call to action would consist of some text to encourage the user to sign up.
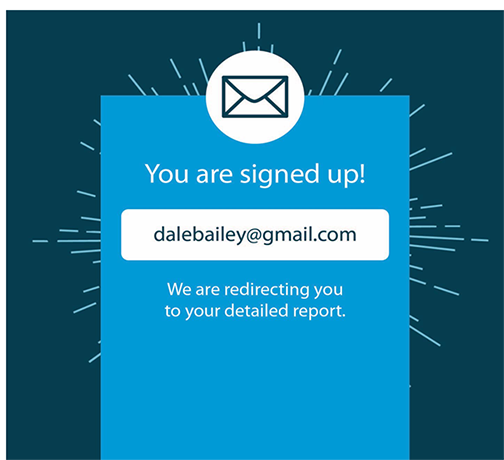
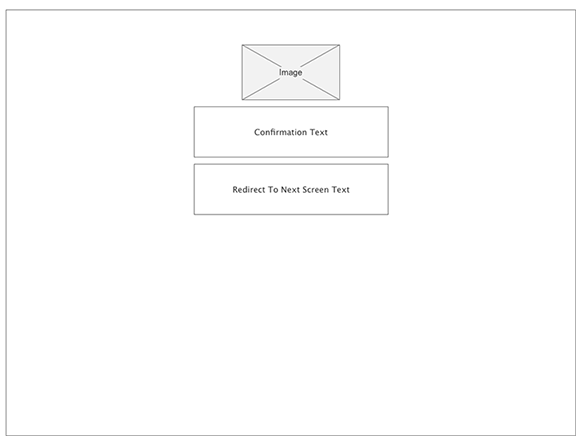
A sign up confirmation (Sketch 3 and Wireframe 2) was also added so that once the user submitted their information in order to demonstrate what they just did as well as what is coming next. The wireframe sign up confirmation consist of a simple icon, the users email, and a redirect message to show the user what is happening next.
Detailed Report and Weekly Email
The initial layout (Sketch 4) of the detailed report consisted of the problem areas and tips of how to improve the problems. The idea behind this was that it was simple and straightforward however after some thought I felt that it would not provide the user enough information on what they need, after all this is supposed to be a detailed report.
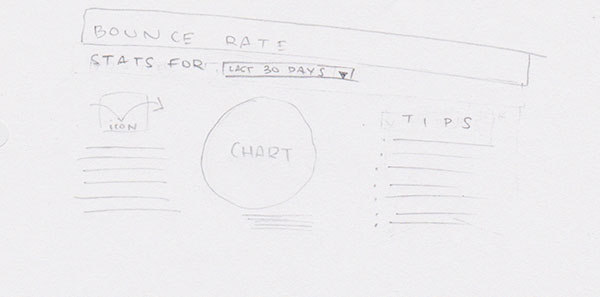
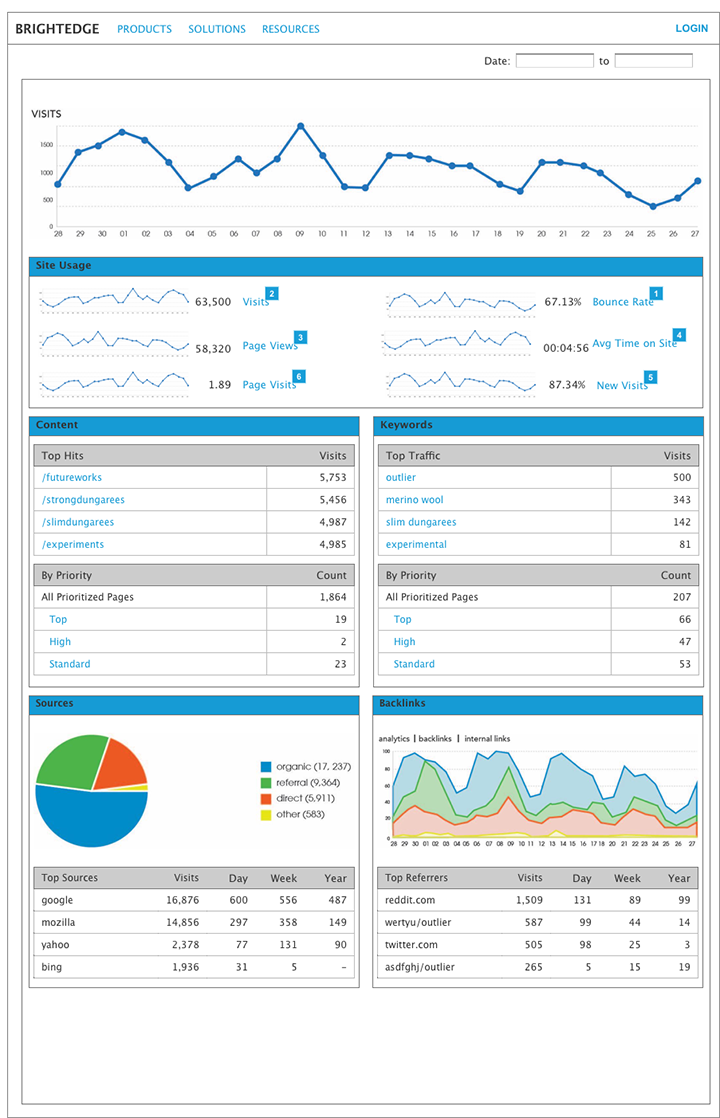
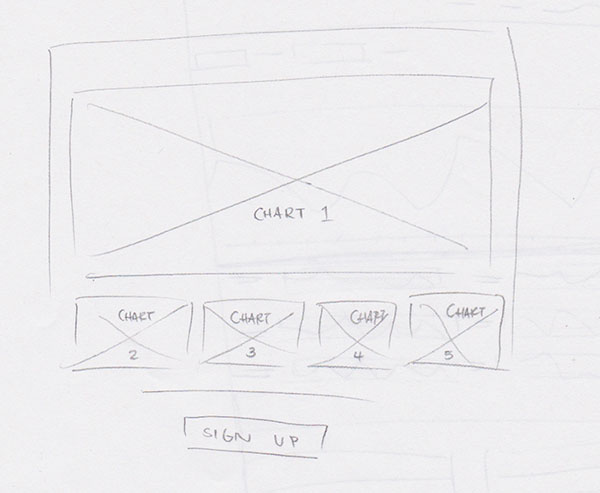
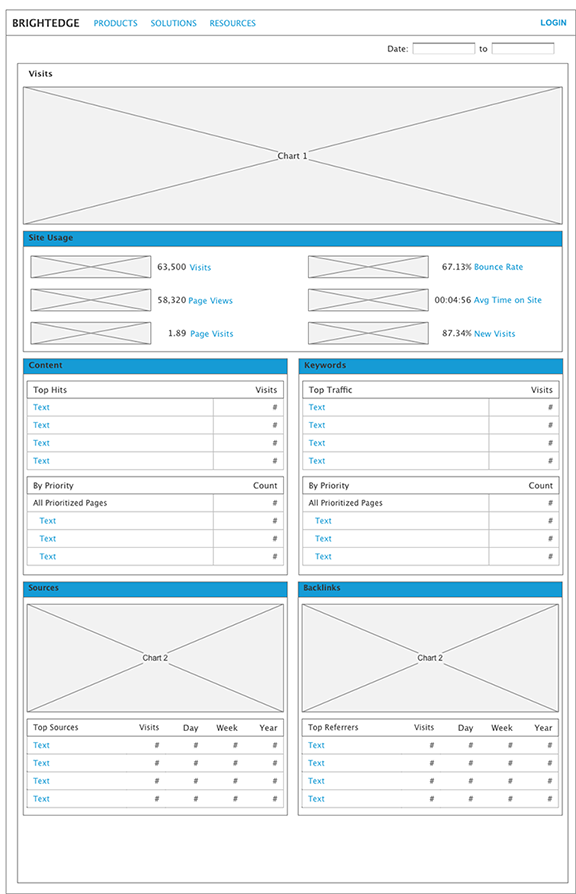
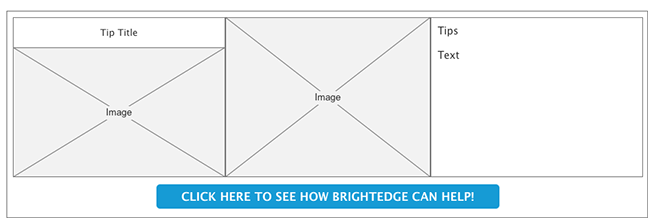
A revised sketch (Sketch 5) was done of the detailed report, one that would incorporate the idea from first detailed report idea along with providing the user enough information about their site and ways to improve it. The report (Wireframe 3) provides a more in-depth look into the users site and provides content that is relevant in identifying problem areas. The report is broken out from high level information to in depth information. Site visit and site usage are at the top as to provide a quick high level overview of the site. Should the user want to get an more in depth look at the stats they would select one of the text links for instance bounce rate and a popup window (Wireframe 4) would be displayed providing details and tips related to the link. A call to action is placed on at the bottom of the tips screen in order to encourage the user to check out additional products that BrightEdge might have to help with the problem area. As the user scrolls down the more detailed aspects of the site are displayed.
Prototype
After completing the wireframes I wanted to create a slightly more polished screens and make the wireframes interactive. Below are the screens to the prototype. For the prototype I included charts and images as well as making some of the screen interactive.